9.26.2022 Market Update

Day after day there is more and more blood in the streets. The fed is hiking rates (as expected) and the R word (recession) is popping up more and more. The S&P 500 is getting dangerously close to the year's low made this past June. So what now?
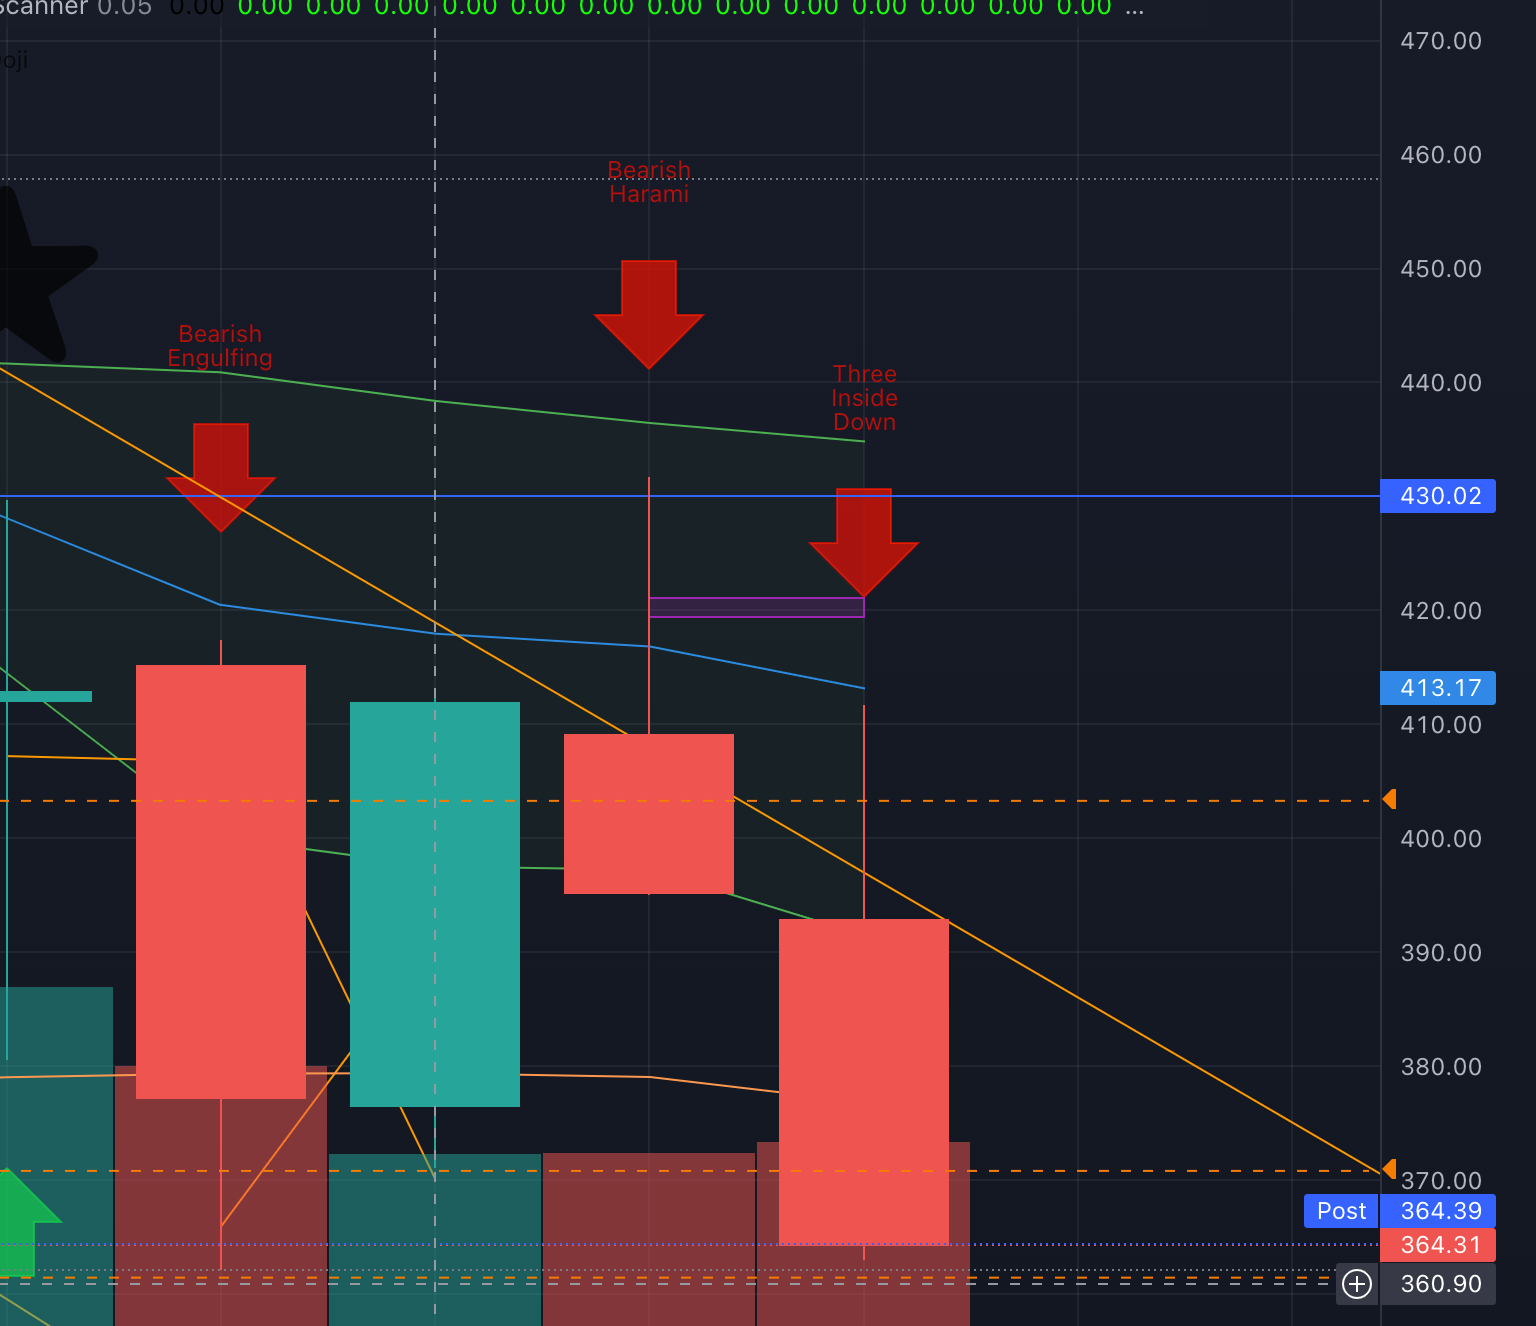
We continue to track the market carefully in addition the actions of the fed and the other major global economies. Many traders are expecting a Double bottom pattern to form (a bounce up off a bottom) at current level. The key number to watch on SPY (our favorite S&P 500 ETF) is 362.14, this is the June low and is the low for 2022. A bounce to the upside at this level would confirm the double bottom pattern.
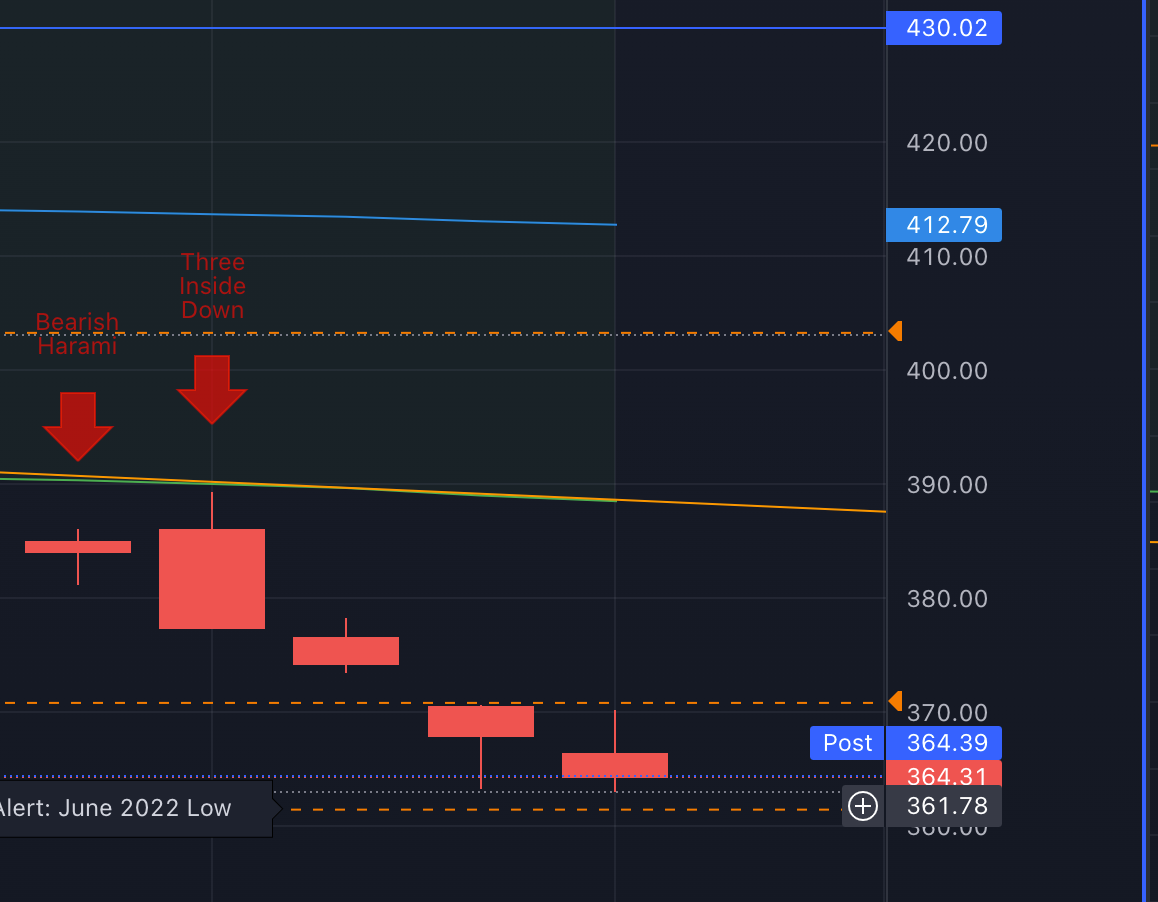
That said, even if there is a bounce, we believe the trend will continue to remain bearish until we see a larger sign of a reversing trend. The current monthly SPY candle continues to hold a Three Inside Down pattern (a bearish pattern, especially on larger time frames such as the weekly and monthly time frames). A close at or below the current level on SPY at the end of the month will be very bearish for the overall market.
Until proven otherwise, we remain cautious in these market conditions and are looking to short every move to the upside until we see signs of a reversal for the current strong bearish trend.
Feel free to leave questions in the comments below or on twitter.
Happy Trading!
Photo by Mark Basarab on Unsplash